The Teams Report
The Teams report consists of dashboards of key performance indicator or KPI data for each team. It can be switched over to Agent statistics and reporting.
A teams dashboard displays for each of your teams, showing data specific to that team.
This report is filtered by your associated business unit(s). If your account is a user without agent or supervisor type, the report will show entries from all business units.
Select Teams under the Reports heading in the portal sidebar to display the Teams Report.
Teams core KPIs
Initially each team’s dashboard displays six core KPIs.
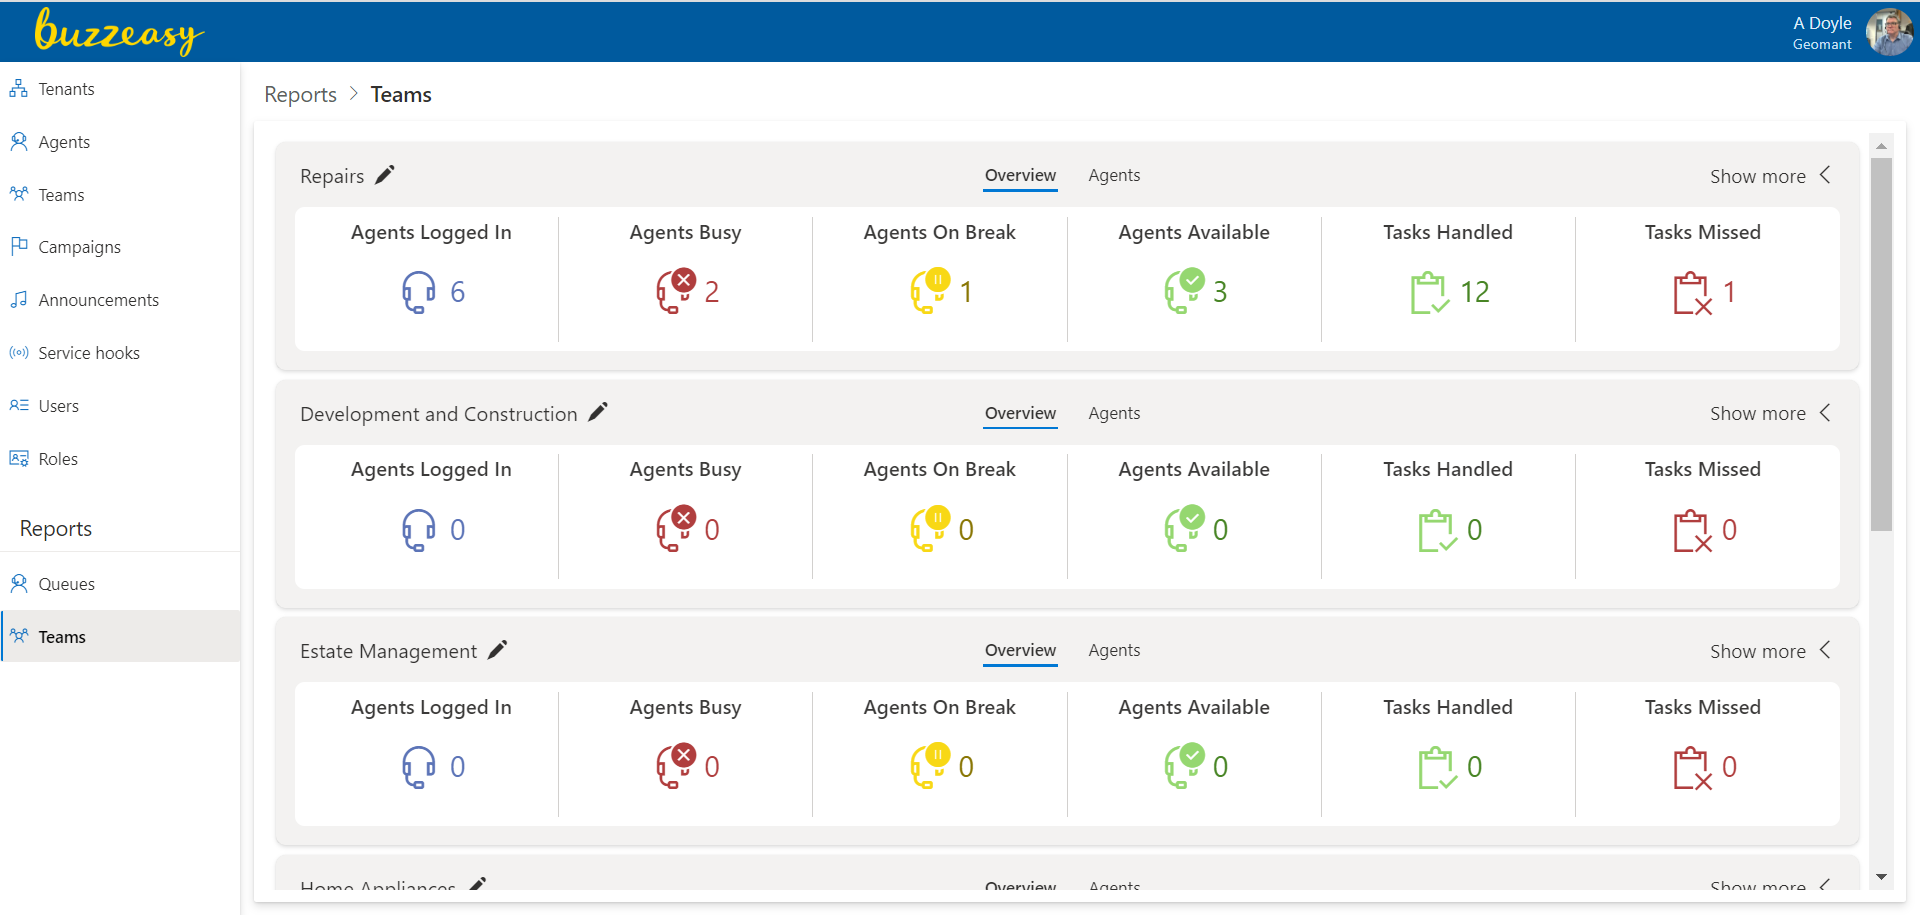
| KPI | Description |
|---|---|
Agents Logged In |
Total team member agents logged in. |
Agents Busy |
Total agents busy with conversations. |
Agents On Break |
Total agents on break. |
Agents Available |
Total agents available to handle conversations. |
Tasks Handled |
Total conversation tasks handled that day. |
Tasks Missed |
Total abandoned conversation tasks. |
Tip
When viewing a lot of teams, try adjusting the zoom settings of your browser.
Additional KPIs
Click Show more at the top right corner of the team dashboard to view additional KPIs. The control label changes to Show less.
Toggle the expanded or collapsed view by clicking these controls.
Team availability
A stacked horizontal bar chart.
| KPI | Description |
|---|---|
| Busy | Total agents currently busy with conversation tasks. |
| Break | Total agents currently on break. |
| Idle | Total agents in idle state, available to handle conversation tasks. |
Break reasons
A stacked horizontal bar chart presenting the topmost used break types.
| KPI | Description |
|---|---|
| Default Break | Duration this break was used, presented visually as a proportion of all break durations - A system defined break type. |
| RONA Break | Duration this break was used, presented visually as a proportion of all break durations - A system defined break type. |
| Administrator Configured Break Name | Duration a break-name configured by an administrator was used. This repeats for each configured break name. Displays as a proportion of total break durations. |
Click the Additional details icon at the top right corner of this KPI to view the metric for the full list of all break types used.
Tasks by disposition code
Stacked horizontal bar chart showing the topmost used disposition codes.
| KPI | Description |
|---|---|
| unspecified | Total number of times no disposition code was used. |
| Administrator Configured Disposition Code | Total number of times this disposition code was used - repeats for each configured code. |
Click the Additional details icon at the top right corner of this KPI to view the metric for the full list of all disposition codes used.
Tasks by media type
Four horizontal bar charts, consisting of media specific KPIs:
Voice tasks
KPI Description Average handling time Average voice call handling time. Handle ratio Calls handled out of the total offered. Missed calls will lower the ratio Email tasks
KPI Description Average handling time Average email task handling time. Handle ratio Emails handled out of the total offered. Missed emails will lower the ratio Total emails sent Count of how many emails the team sent, this includes replies, outbound emails as well as forwards done by agents. Chat tasks
KPI Description Average handling time Average chat handling time. Handle ratio Chats handled out of the total offered. Missed chats will lower the ratio - External tasks
KPI Description Average handling time Average handling time for scripting related tasks
Edit visual thresholds
Apply threshold values to task handling KPIs for quick feedback on performance trends. When thresholds are met, KPI visuals change to draw your attention.
Select Teams from the Realtime Reports section in the Graia CCaaS Portal sidebar.
Identify the team where you want to edit a threshold, and click Show more at the top right hand corner of the dashboard to view the current KPI trends.
Click the Edit thresholds icon at the top left corner of the dashboard, right next to the team name label.
Set the Average handling time and/or Handled ratio thresholds for some or all media type(s).
Save the updated thresholds.
Watch the media specific task handling KPIs. Notice how the style changes as the threshold values are met.